Know Your DEAL
Understand the financial trade-offs. Four simple measures that show how your financial resources work together.
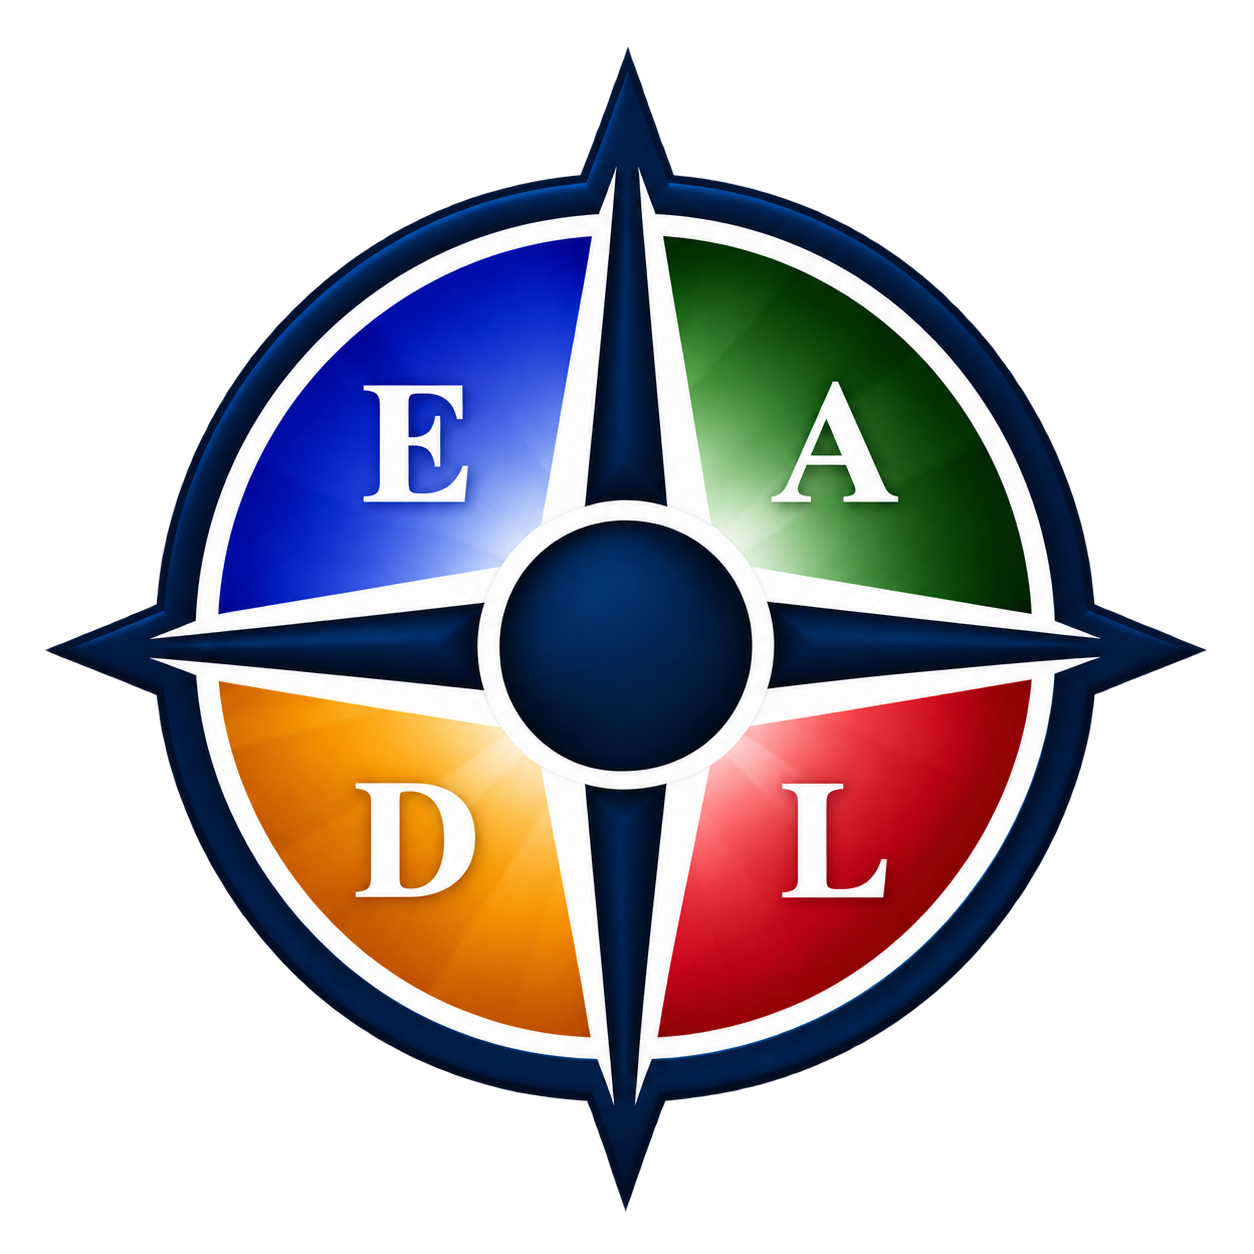
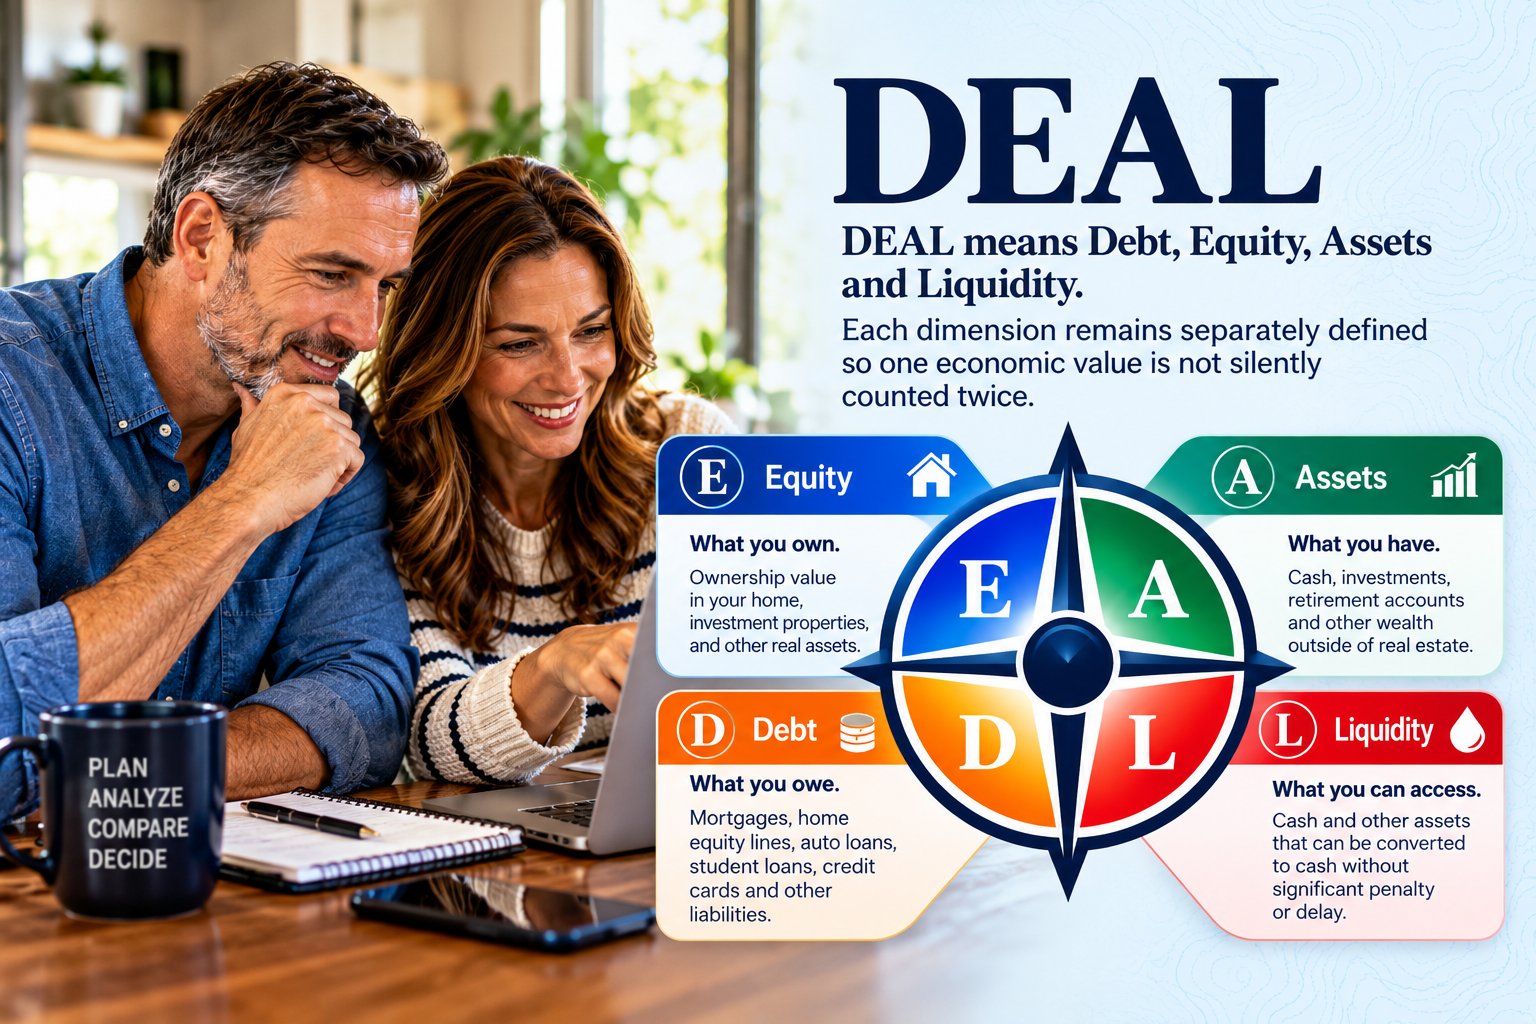
The DEAL Compass reads your household the way a business reads its books. Debt is what you owe. Equity is what you own relative to what you owe. Assets are what you have. Liquidity is what you can access. Together, they show where your household stands — and where a decision might take it.
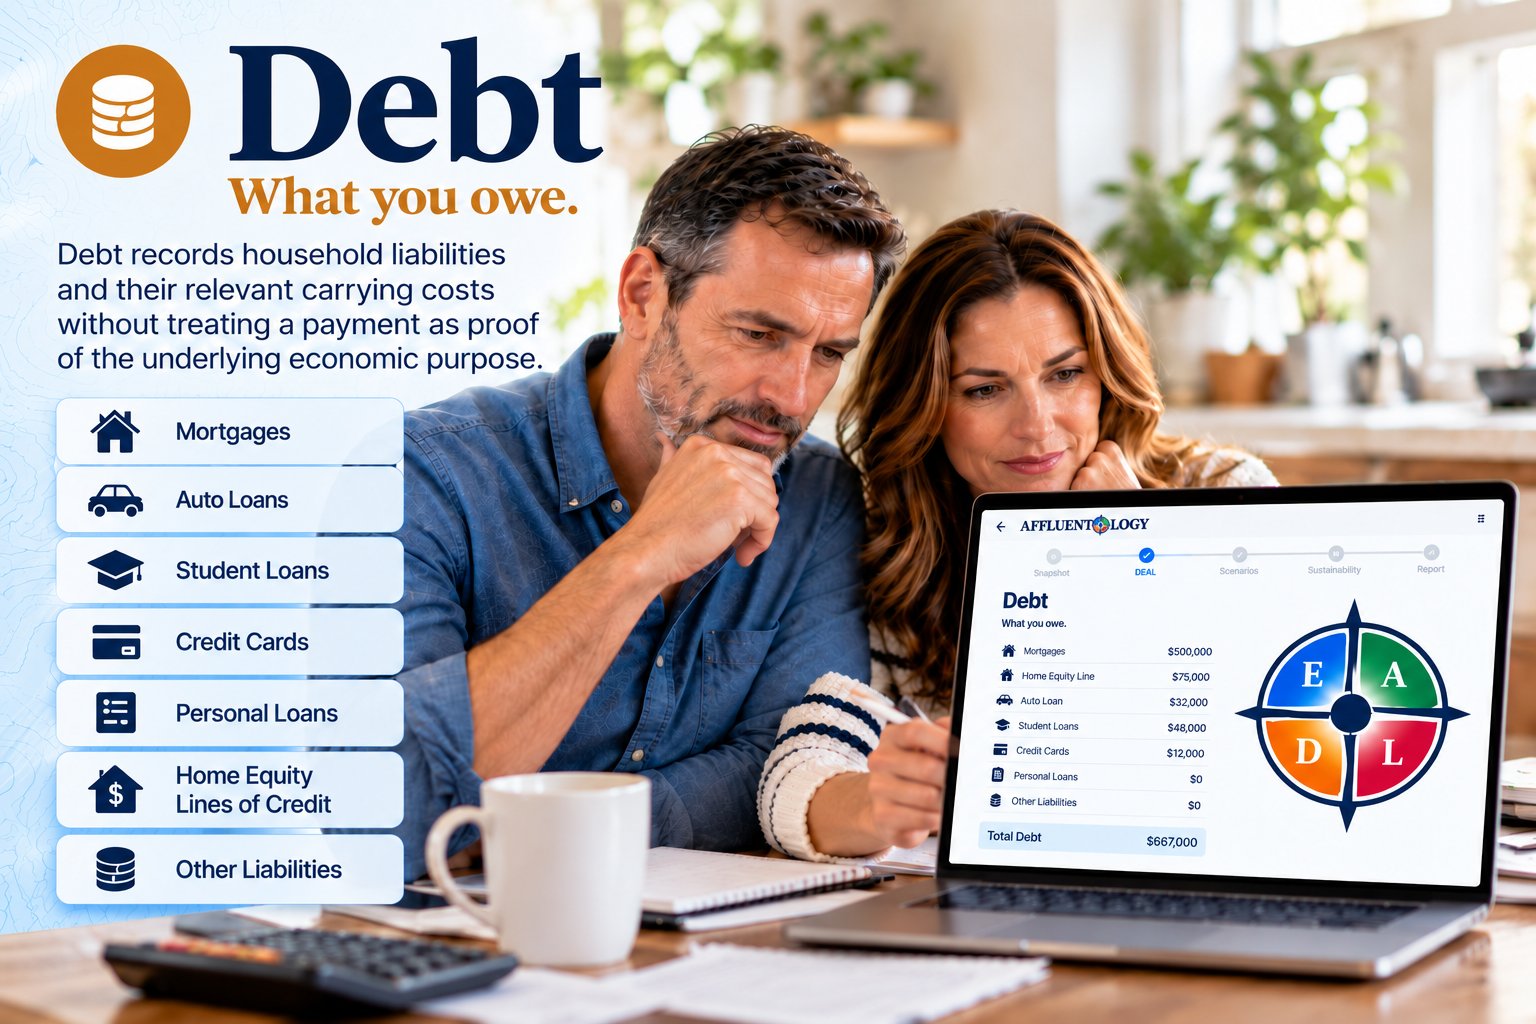
D — Debt
Debt is what you owe — mortgages, loans, and credit cards. It has a cost: interest and monthly payments. And it affects your cash flow and your flexibility: money committed to debt payments is money you cannot use for something else.
E — Equity
Equity is what you own relative to what you owe. A home worth $800,000 with a $500,000 mortgage carries $300,000 of equity. Equity grows as you pay down debt or as values rise — but equity on paper is not the same as money you can use.

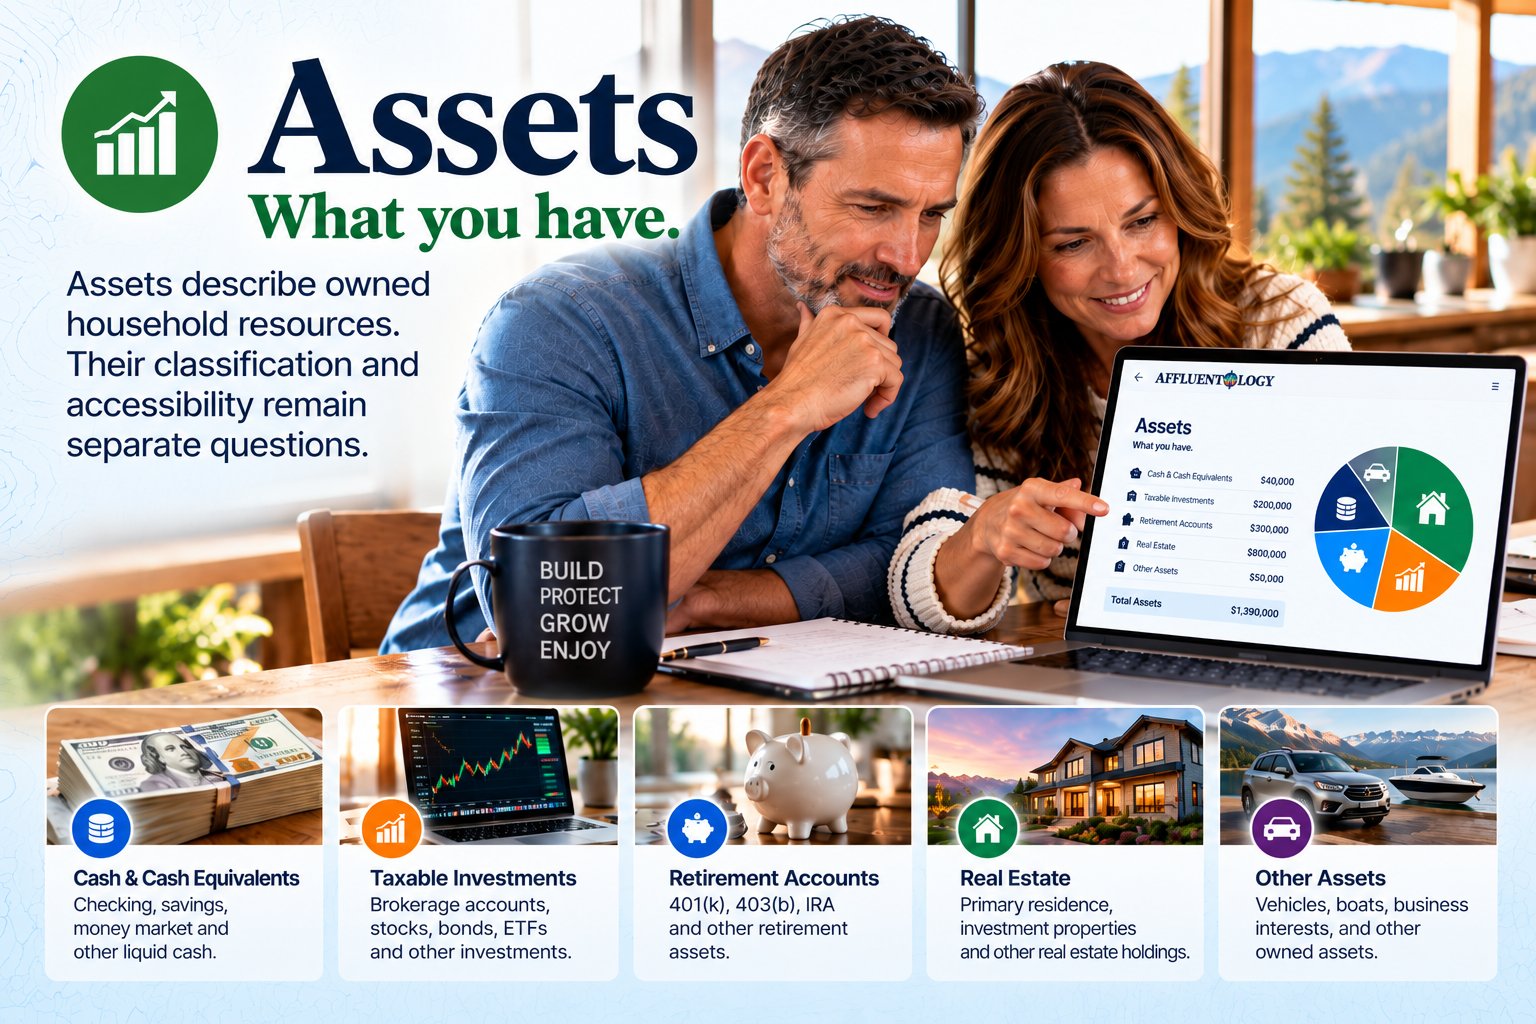
A — Assets
Assets are the resources you own — cash, taxable investments, retirement accounts, real estate, and more — and what they could do for you. An asset’s value is only part of the story: what matters is what that asset can support, and when.
L — Liquidity
Liquidity is the resources you can actually access — cash, savings, money market funds, and taxable investments you can reach when you need them. A household can be rich on paper and still short of money it can use. That is why liquidity is measured separately.
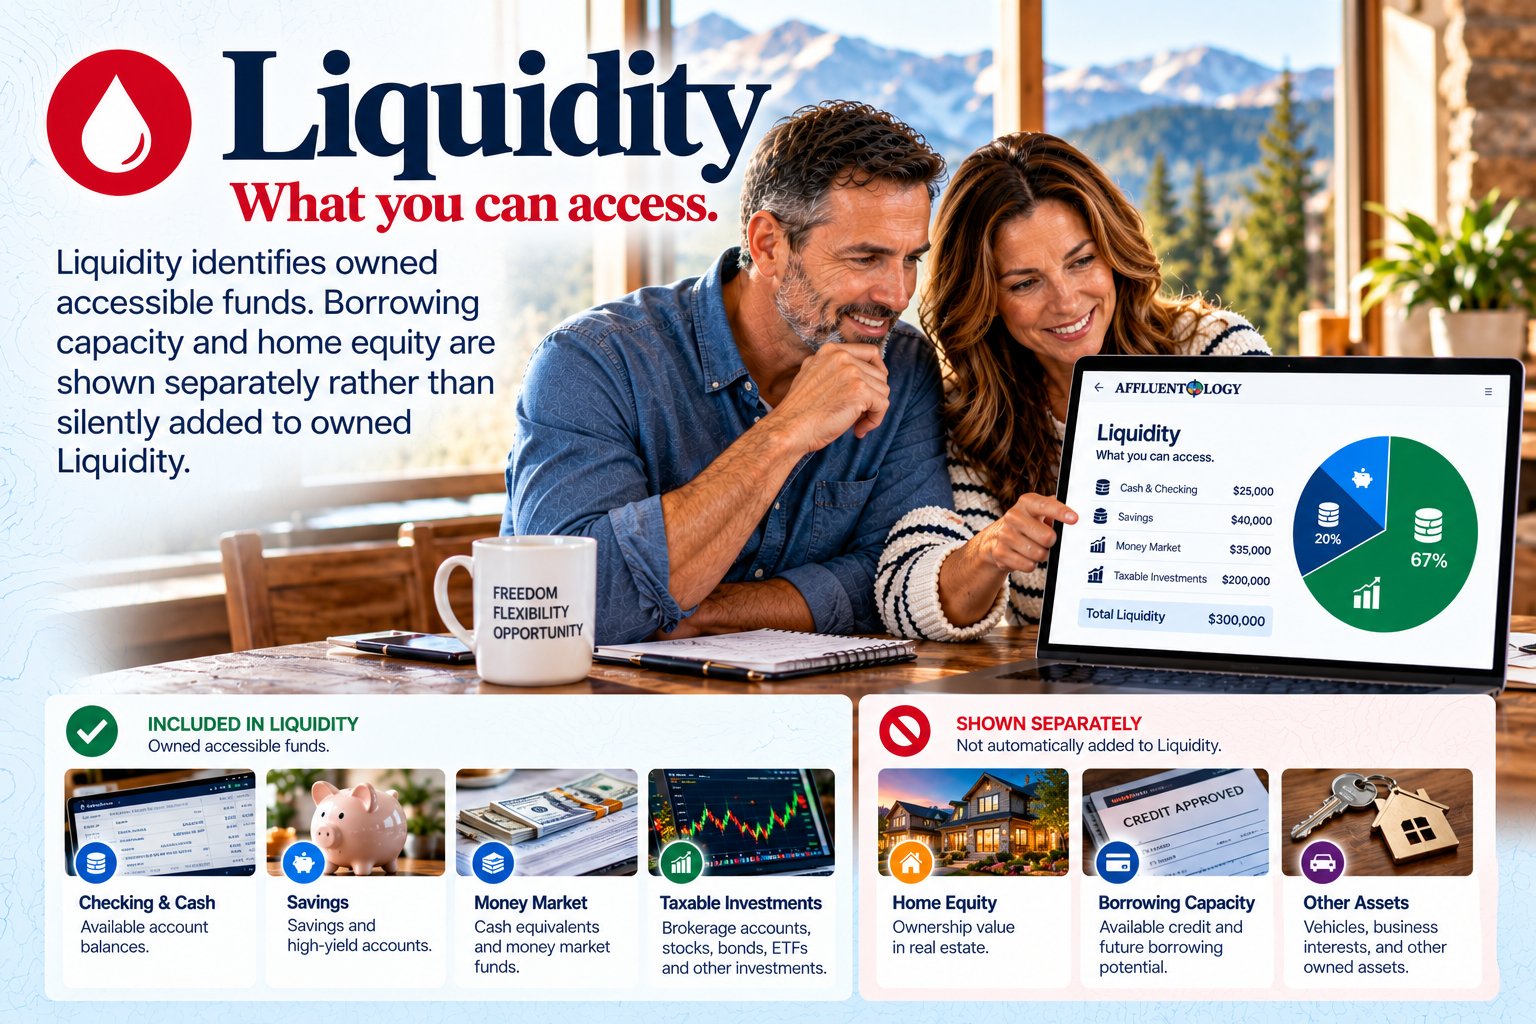
How the four work together
No single number tells the story. Net worth, equity, assets, and liquidity each show a different part of your household. See how your financial resources work together — and the trade-offs between them.
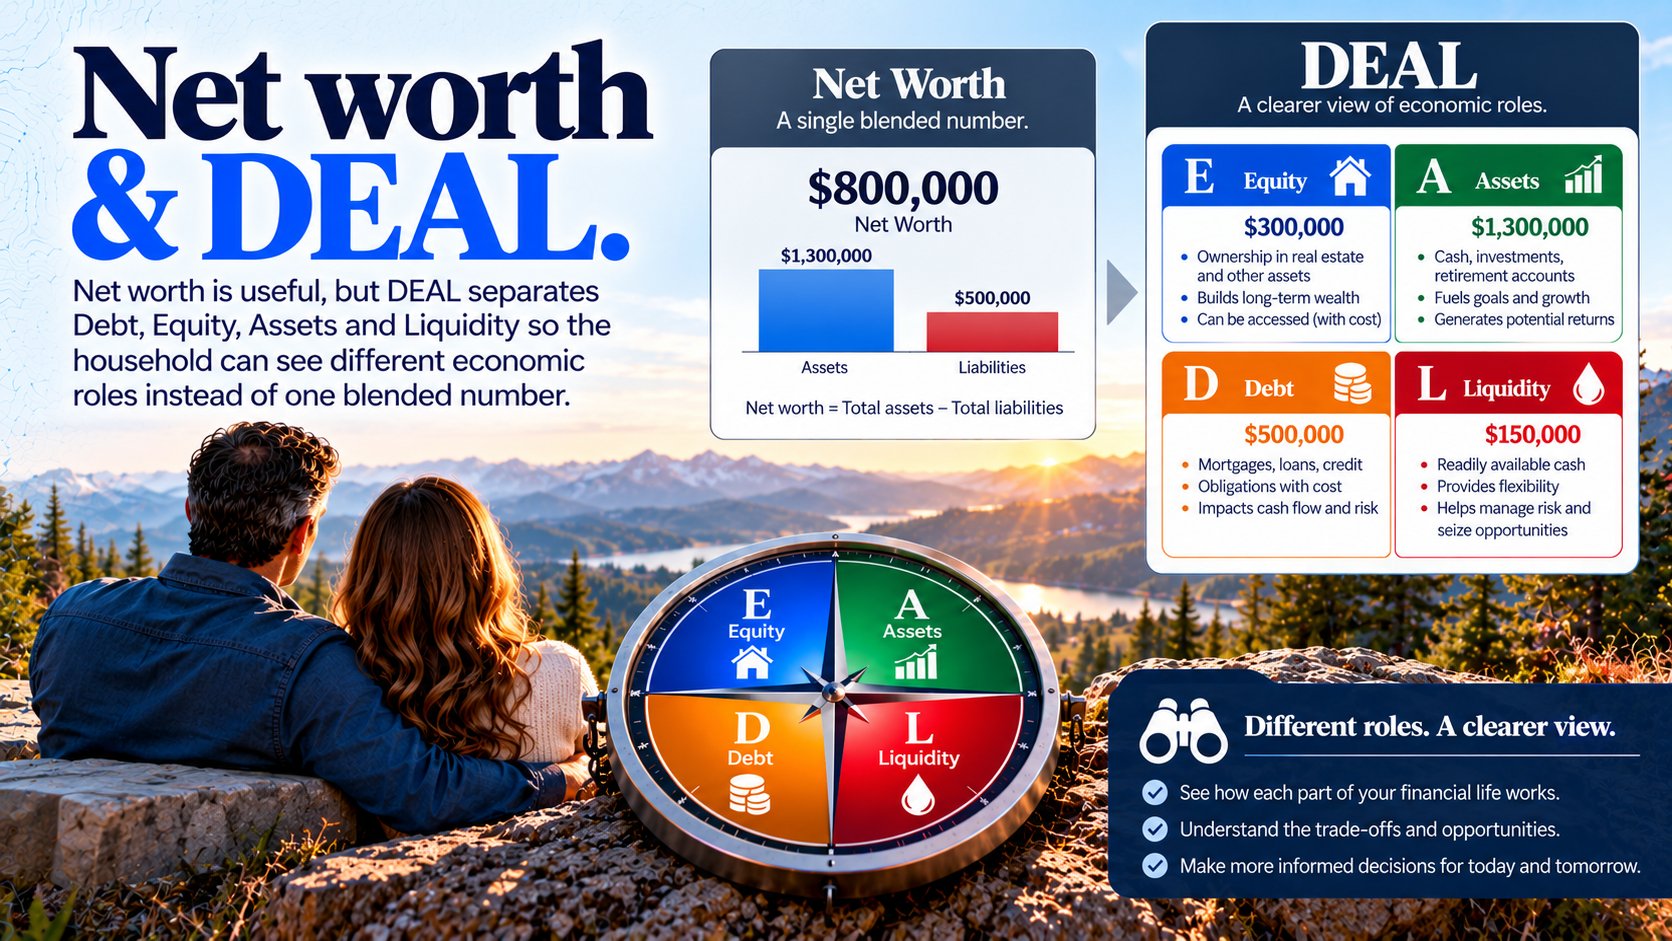
Consider paying off a mortgage: it can reduce debt and monthly expenses — while also reducing the accessible liquidity you hold. The same decision improves one measure and reduces another. That is the trade-off Affluentology helps you see, so you can decide with greater clarity.
Household economics
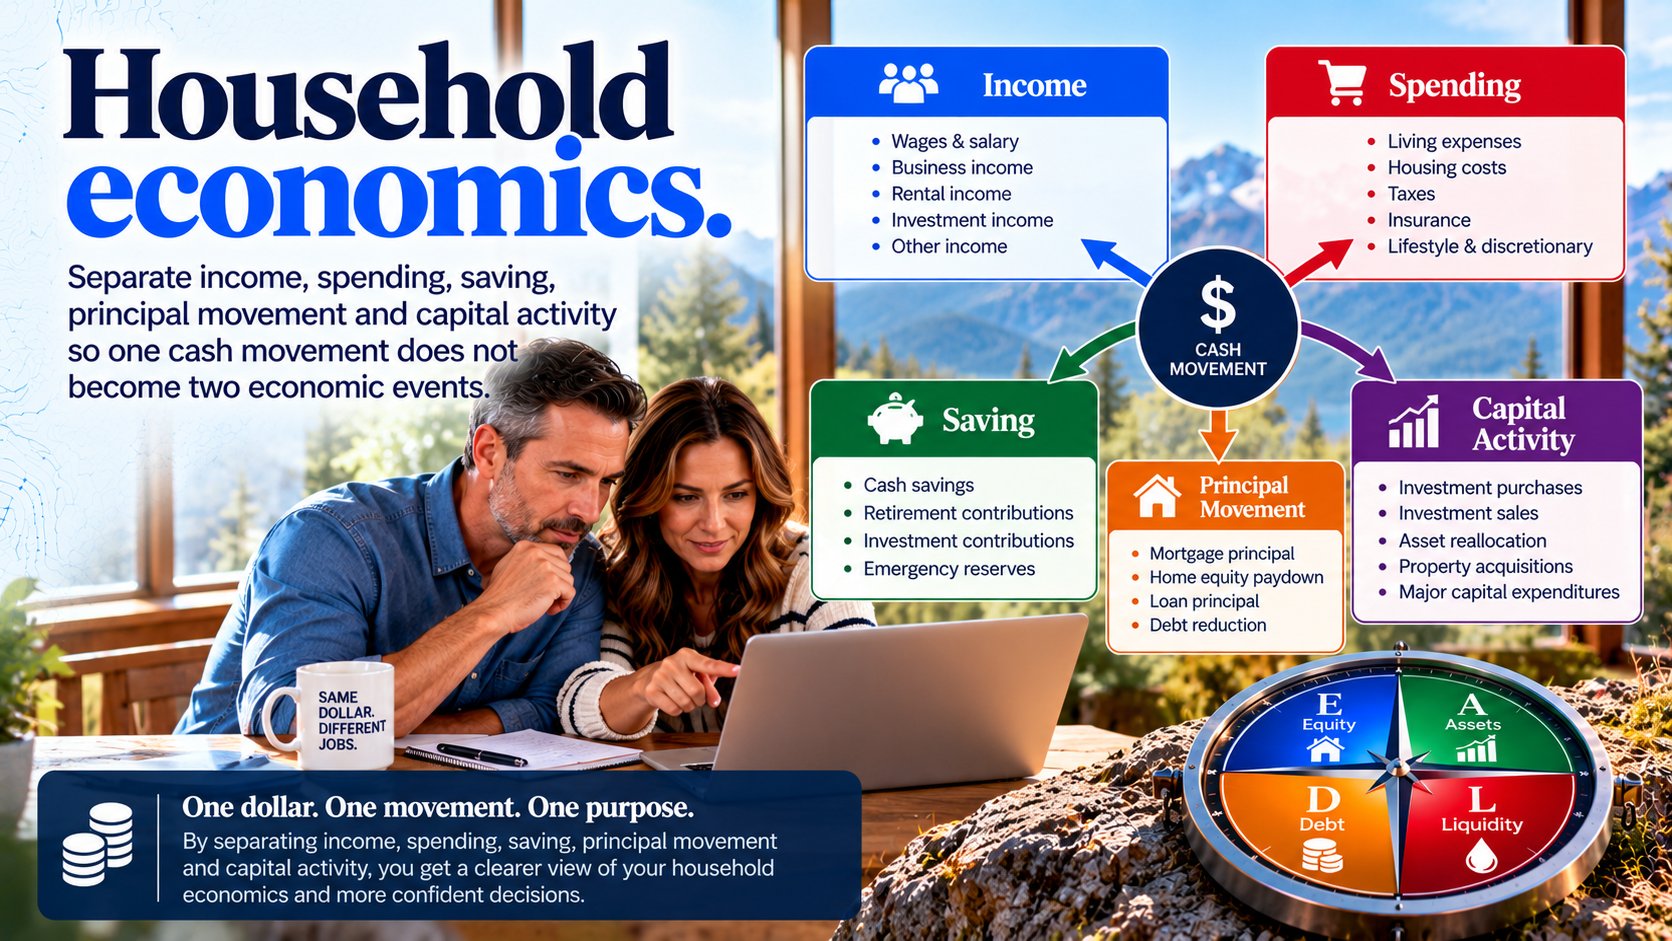
Your household has flows as well as balances: income, spending, saving, principal movement, and capital activity. Affluentology separates them, so you can see what is really happening with your money — and prepare for more informed conversations with professionals.
The destination is sustainability
Sustainability means your household can keep going — year after year. Explore how decisions may affect your household over time, and what your resources could support.
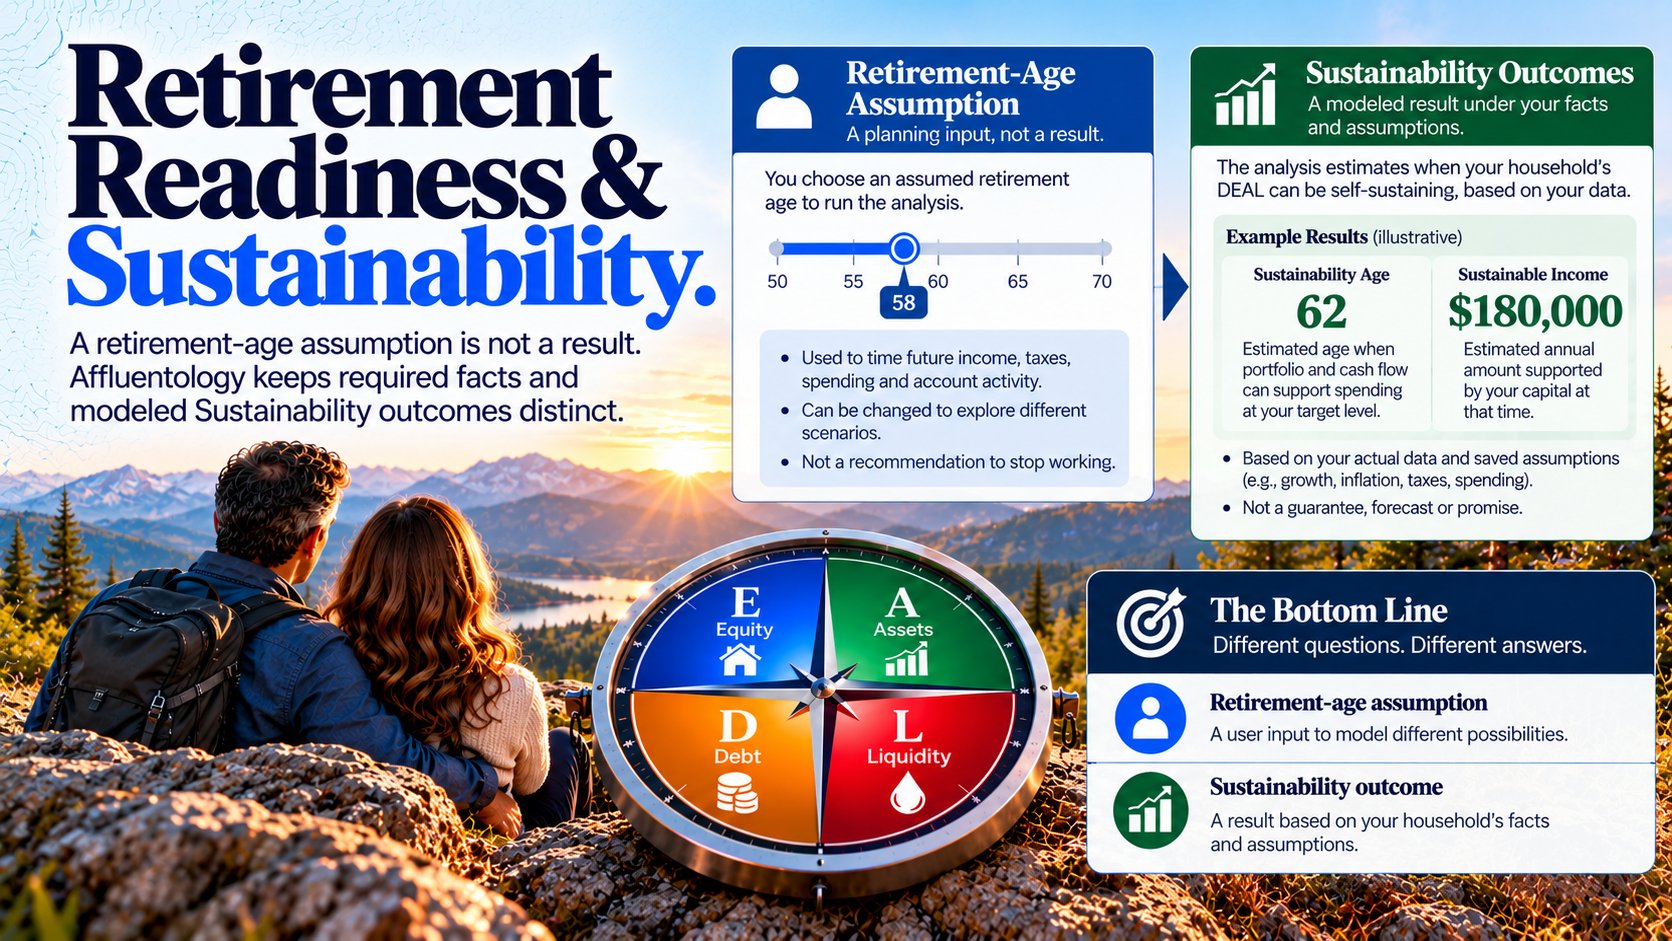
Affluentology provides analysis, not personalized investment, tax, or legal advice. It does not execute transactions or make decisions on behalf of households. Modeled results are not guarantees or forecasts.
We provide. You decide.